A Financial Dashboard should represent a one-page graphical snapshot of Key Performance Indicators:
1. Key Trends
2. Comparisons
3. Expectations
Companies create dashboards to monitor their performance. Keep the following in mind when creating your dashboard for real-time decision making:
- Compare current performance to prior periods and future expectations.
- Display your dashboard where you can see it often and revel in your success.
- Consolidate data in a clear, well designed format. Use colorful pie charts, tables and bar graphs to easily see historical trends.
- Display your data in logical groupings to compare your results easily.
- Keep the end user in mind so your data is both useful and easy to understand. Is the information for you or your employees?
- Make the Dashboard easy to update. For example, add columns to a spreadsheet that converts to a graphic automatically.
Focus on THREE areas
Keeping 4 or 8 or 10 balls in the area is impossible. Keep your dashboard simple. Pick three areas you want to focus on and you will see improvement. When companies have too many goals, results are compromised.
Create your dashboard to meet your needs
Dashboards are like fingerprints – no two are the same. Think about your goals. What areas could you monitor to improve the possibility of reaching those goals?
Consider capturing data in the following areas:
- Revenue
- COGS or Gross Profit
- Expenses and Costs
- Sales by Product
- Sales by Employee
- Sales by Customer
- Number of Customers
- Number of Leads
- Number of New Clients
- % of Leads Closed
- Billable Hours per Month
- Number of days to close a prospect
- Quick Ratio
- Cash on Hand
- Account Receivable – Days to get paid
- Accounts Receivable
- Average Sale $
- Profitability by Client
Examples:
Cash on Hand – If your goal is to improve cash flow.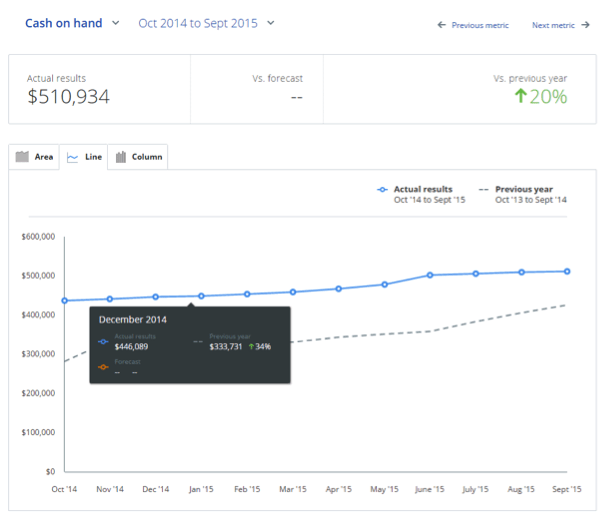
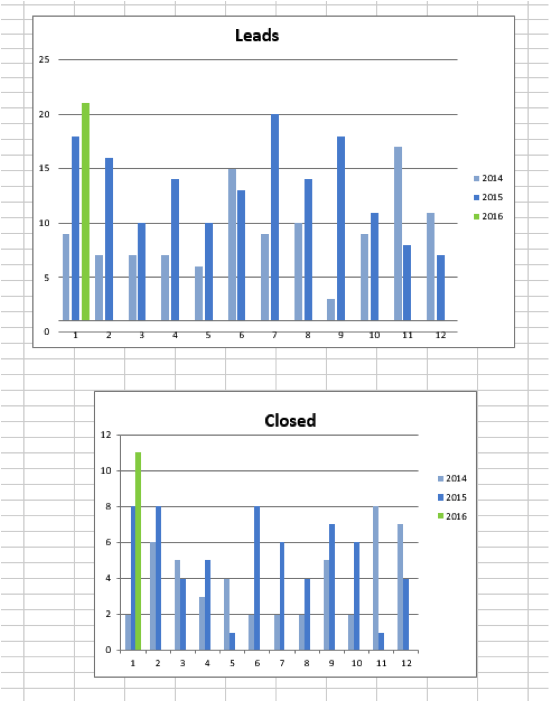
Lead Generation:
Need advice setting up your Financial Dashboard? Contact BudgetEase below for a free consultation.